Usage#
Show code cell source
fname = "data/2021/numpy_survey_results.tsv"
column_names = [
    'version', 'version_other', 'primary_use','use_freq','components','use_c_ext',
    'using_random', 'bug', 'bug_resolution', 'bug_resolution_other',
    'unsolvable', 'unsolvable_resolution', 'unsolvable_resolution_other',
    'issues','issues_other',
    'deprecation_short', 'deprecation','deprecation_other'
]
featdep_dtype = np.dtype({
    "names": column_names,
    "formats": ['U1024'] * len(column_names),
})

data = np.loadtxt(
    fname, delimiter='\t', skiprows=3, dtype=featdep_dtype,
    usecols=[22,23,24,28,29,30,73,74,75,76,77,78,79,80,81,82,83,84], comments=None, encoding='UTF-16'
)
This section comprises various questions to try to gain insight on things like new feature adoption, issue resolution, and the length of deprecation cycles.
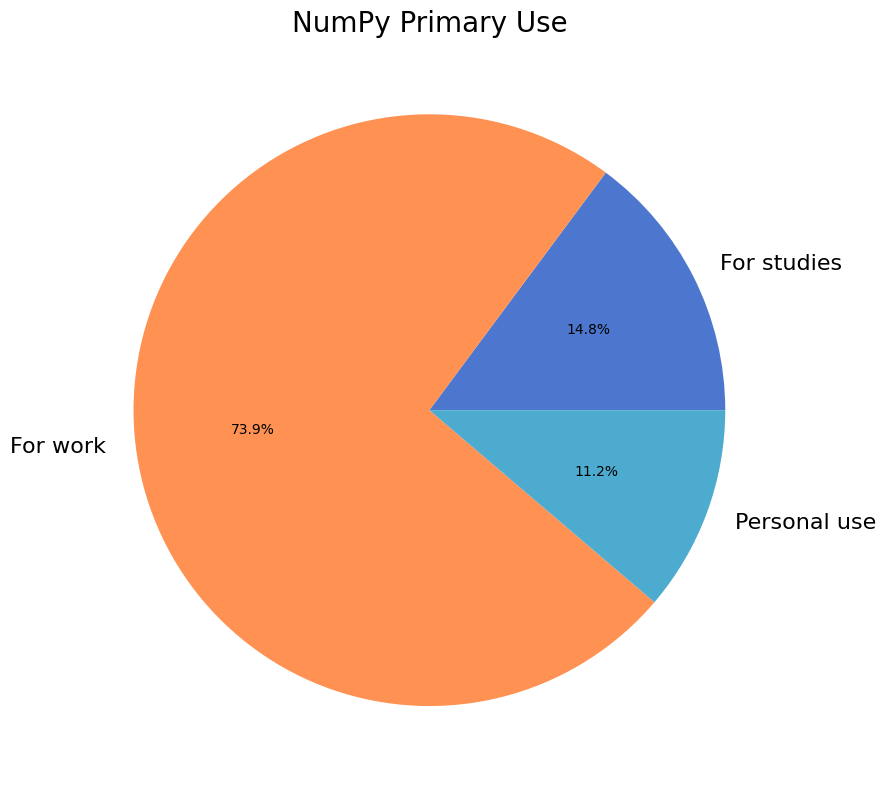
NumPy Primary Use#
418 (80%) respondents provided information about the primary context in which they use NumPy. Almost 3/4 of respondents use NumPy for work.
Show code cell source
uses = data['primary_use'][data['primary_use'] != '']
labels, cnts = np.unique(uses, return_counts=True)

fig, ax = plt.subplots(figsize=(12, 8))
ax.pie(cnts, labels=labels, autopct='%1.1f%%')
ax.set_title("NumPy Primary Use");
fig.tight_layout()

glue(
    '2021_num_primary_use_respondents',
    gluval(uses.shape[0], data.shape[0]),
    display=False
)
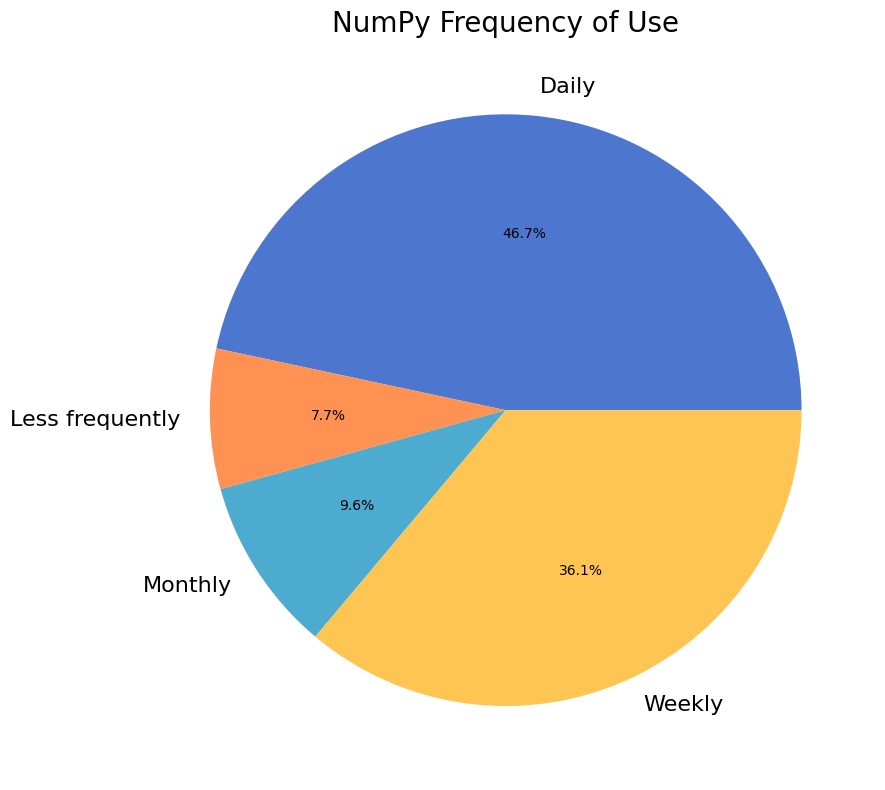
NumPy Frequency of Use#
418 (80%) respondents provided information about how often they use NumPy. Most respondents use NumPy on a daily or weekly basis.
Show code cell source
use_freq = data['use_freq'][data['use_freq'] != '']
labels, cnts = np.unique(use_freq, return_counts=True)

fig, ax = plt.subplots(figsize=(12, 8))
ax.pie(cnts, labels=labels, autopct='%1.1f%%')
ax.set_title("NumPy Frequency of Use");
fig.tight_layout()

glue('2021_num_freq_respondents', gluval(use_freq.shape[0], data.shape[0]), display=False)
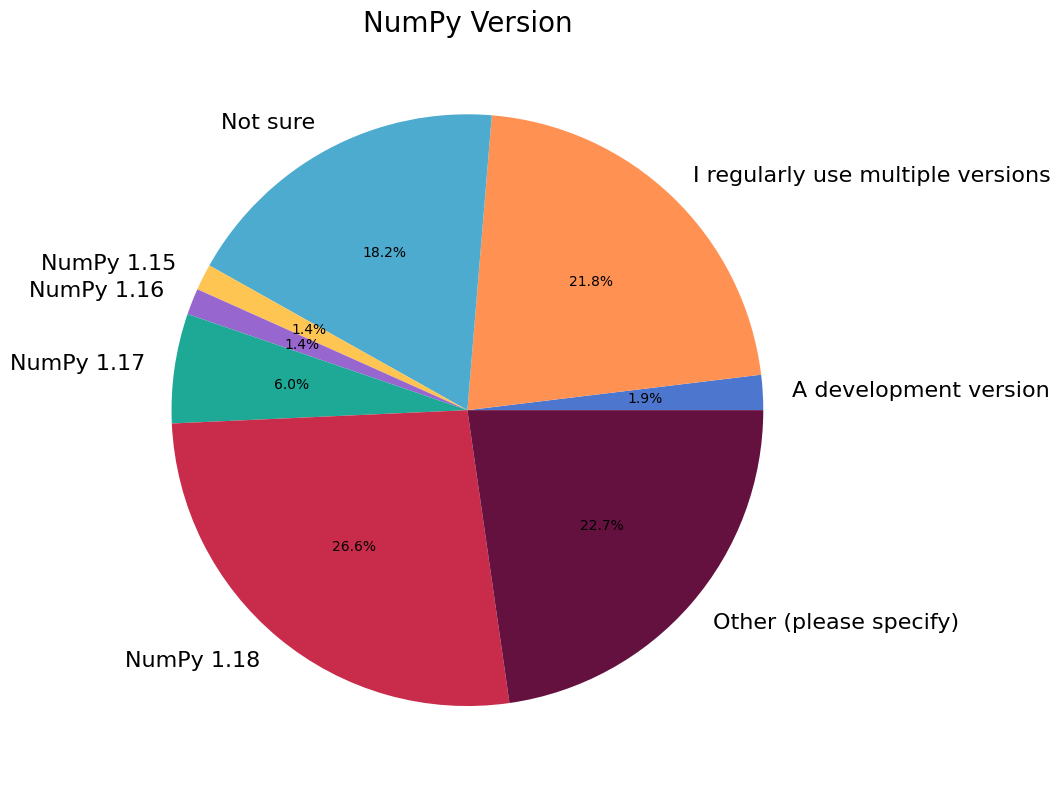
NumPy Version#
NumPy 1.21 was the latest stable release at the time the survey was conducted. 50.7 percent of respondents report that they primarily use an older version of NumPy.
Show code cell source
vers = data['version'][data['version'] != '']
labels, cnts = np.unique(vers, return_counts=True)

fig, ax = plt.subplots(figsize=(12, 8))
ax.pie(cnts, labels=labels, autopct='%1.1f%%')
ax.set_title("NumPy Version");
fig.tight_layout()

# Percentage of users that use older versions
older_version_usage = 100 * cnts[-8:-2].sum() / cnts.sum()
glue('2021_older_version_usage', f"{older_version_usage:1.1f}", display=False)
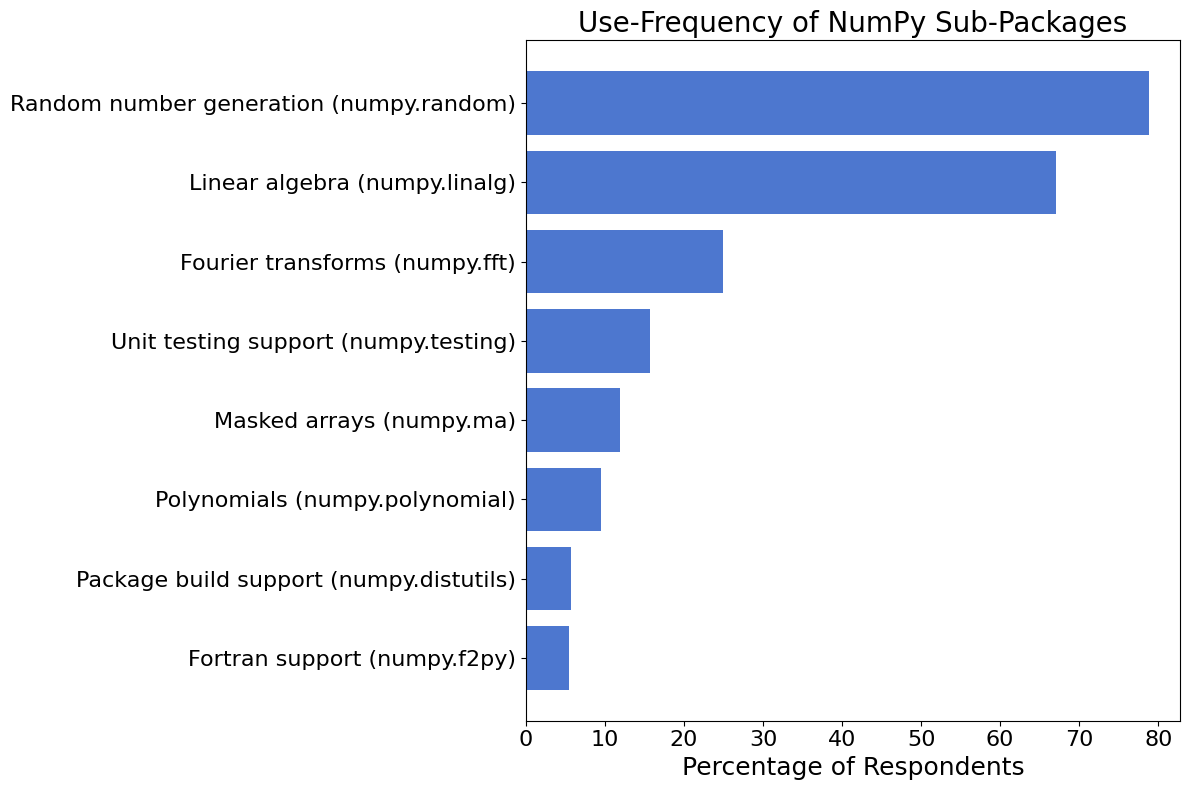
NumPy Components#
NumPy encompasses many packages for specific scientific computing tasks, such as random number generation or Fourier analysis. The following figure shows what percentage of respondents reported using each NumPy subpackage.
Show code cell source
components = data['components'][data['components'] != '']
num_respondents = len(components)
# Process components field
all_components = []
for row in components:
    all_components.extend(row.split(','))
all_components = np.array(all_components)
labels, cnts = np.unique(all_components, return_counts=True)
# Descending order
I = np.argsort(cnts)
labels, cnts = labels[I], cnts[I]
cnts = 100 * cnts / num_respondents

fig, ax = plt.subplots(figsize=(12, 8))
ax.barh(np.arange(len(cnts)), cnts, align='center')
ax.set_yticks(np.arange(len(cnts)))
ax.set_yticklabels(labels)
ax.set_xlabel("Percentage of Respondents")
ax.set_title("Use-Frequency of NumPy Sub-Packages")
fig.tight_layout()
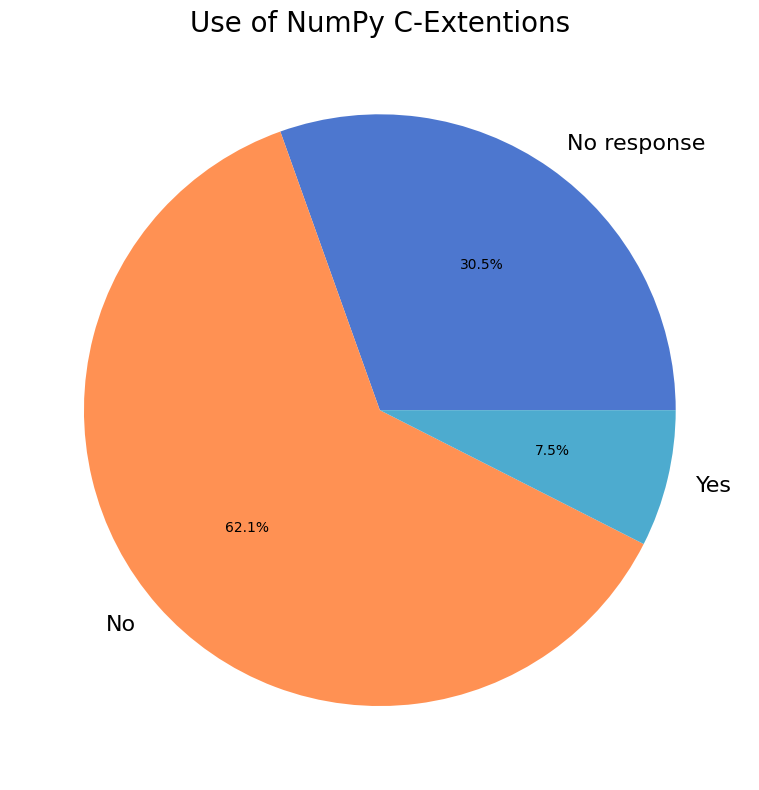
NumPy C-Extensions#
363 (70%) participants shared whether they (or their organization) uses custom C-extensions via the NumPy C-API (excluding Cython). Only about 7% of respondents report use.
Show code cell source
uses_c_ext = data['use_c_ext']
use_c_ext = data['use_c_ext'][data['use_c_ext'] != '']
labels, cnts = np.unique(uses_c_ext, return_counts=True)
labels[0] = 'No response'

fig, ax = plt.subplots(figsize=(8, 8))
ax.pie(cnts, labels=labels, autopct='%1.1f%%')
ax.set_title("Use of NumPy C-Extentions");
fig.tight_layout()

glue('2021_num_c_ext', gluval(use_c_ext.shape[0], data.shape[0]), display=False)
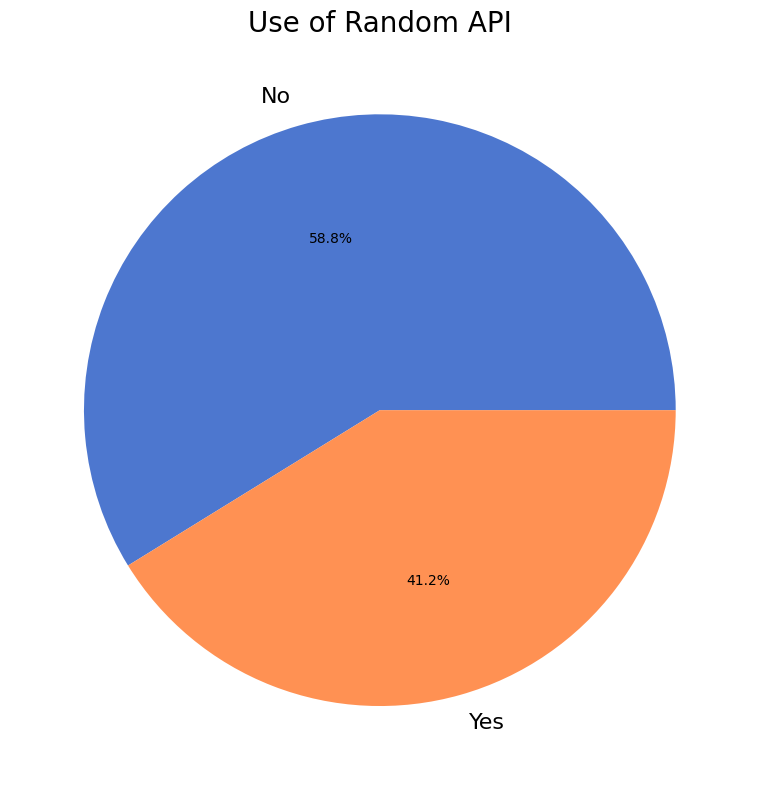
New numpy.random Adoption#
A new API for random number generation was added to numpy.random
in version 1.17.
We asked survey paricipants whether they were using the new random API.
Of the 522 survey participants,
233 (45%) shared whether they were using the new random
API.
Show code cell source
rand = data['using_random'][data['using_random'] != '']
labels, cnts = np.unique(rand, return_counts=True)

fig, ax = plt.subplots(figsize=(8, 8))
ax.pie(cnts, labels=labels, autopct='%1.1f%%')
ax.set_title("Use of Random API");
fig.tight_layout()

glue(
    '2021_num_random_users',
    gluval(rand.shape[0], data.shape[0]),
    display=False
)
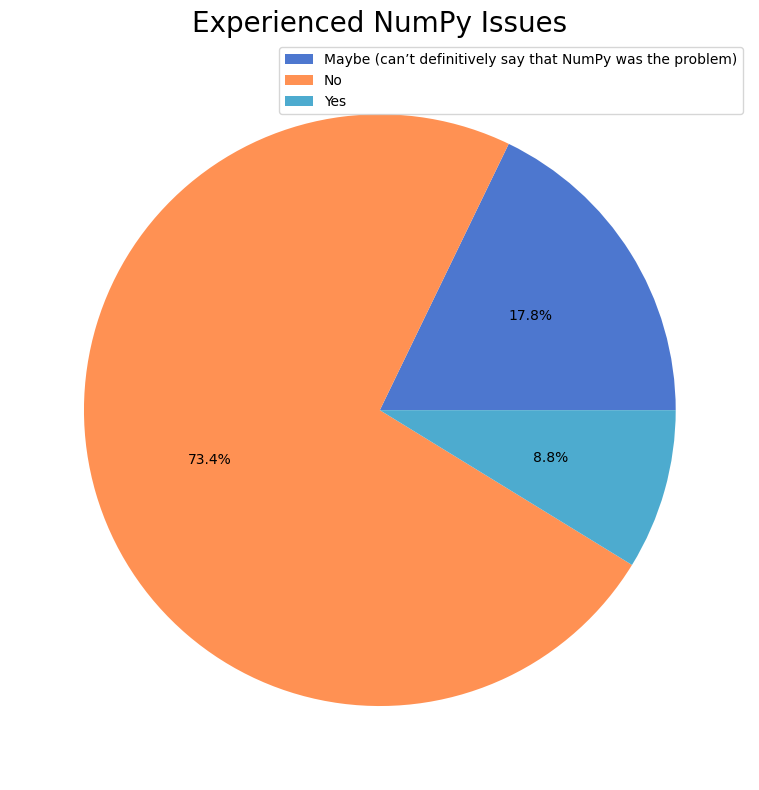
Handling Issues#
We wanted to get a sense of how often users experience issues with NumPy, so we asked the following question:
In the last year, have you experienced problems in code you’ve written stemming from a problem in NumPy?
Of the 522 survey participants,
331 (63%) responded to this question.
Show code cell source
bug = data['bug'][data['bug'] != '']
labels, cnts = np.unique(bug, return_counts=True)

fig, ax = plt.subplots(figsize=(8, 8))
ax.pie(cnts, labels=labels, autopct='%1.1f%%', labeldistance=None)
ax.legend()
ax.set_title("Experienced NumPy Issues");
fig.tight_layout()

glue(
    '2021_bug_reporters',
    gluval(bug.shape[0], data.shape[0]),
    display=False,
)
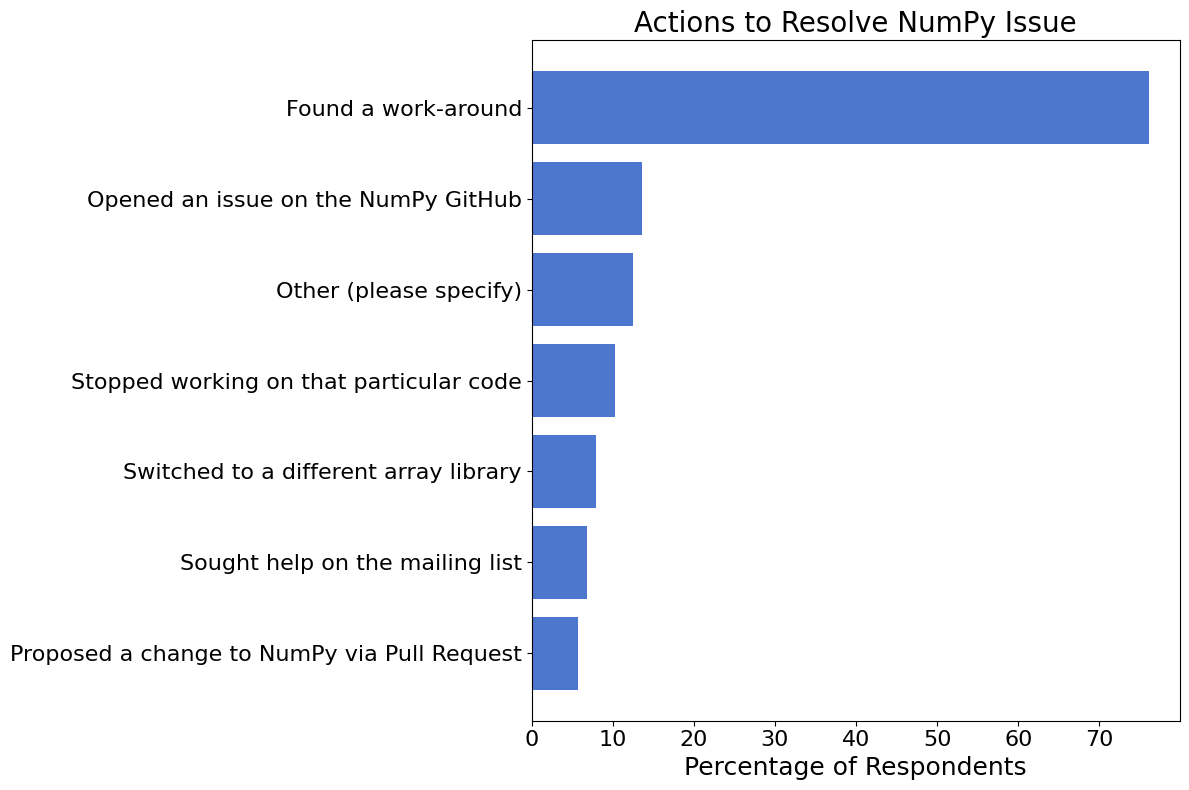
We asked those who reported they experienced issues what action(s) they took to resolve the issue.
Show code cell source
bug_resolution = data['bug_resolution'][data['bug_resolution'] != '']
labels, cnts = np.unique(flatten(bug_resolution), return_counts=True)
I = np.argsort(cnts)
labels, cnts = labels[I], cnts[I]

fig, ax = plt.subplots(figsize=(12, 8))
ax.barh(
    np.arange(len(labels)),
    100 * cnts / bug_resolution.shape[0],
    tick_label=labels,
)
ax.set_xlabel('Percentage of Respondents')
ax.set_title("Actions to Resolve NumPy Issue");
fig.tight_layout()
Data Analysis with NumPy#
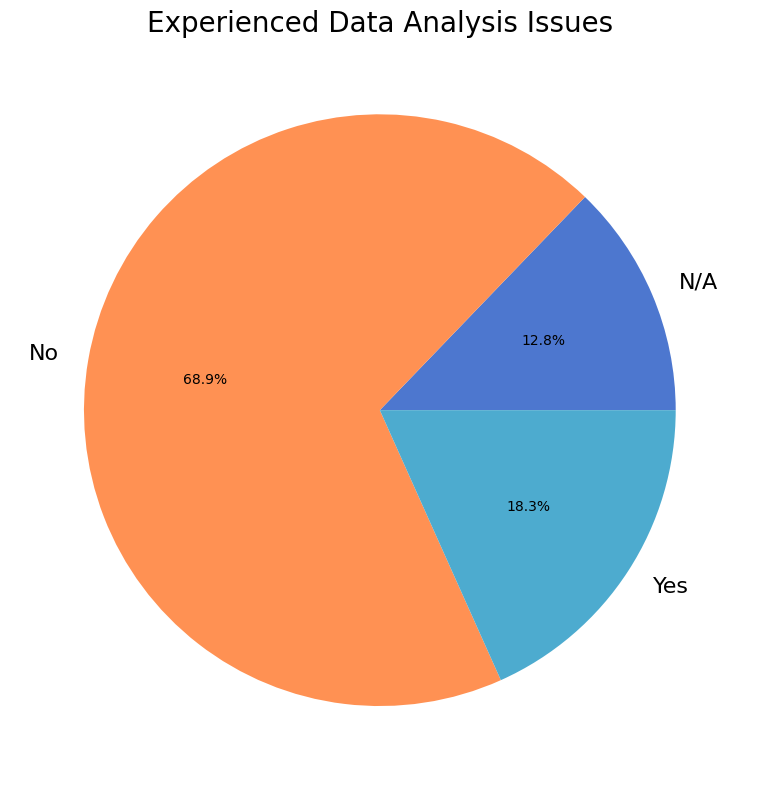
Similar to the the previous question, we tried to get a sense of how well NumPy meets users’ data analysis needs. We asked the following question:
In the last year, have you encountered a problem involving numerical data that you were unable to solve using NumPy?
Of the 522 survey participants,
328 (63%) responded to the above question, with
60 (18%) reporting that they’ve had a problem that they
initially expected to be able to solve using NumPy, but were unable to do so.
Show code cell source
unsolvable = data['unsolvable'][data['unsolvable'] != '']
labels, cnts = np.unique(unsolvable, return_counts=True)
num_yes = np.sum(unsolvable == 'Yes')

fig, ax = plt.subplots(figsize=(8, 8))
ax.pie(cnts, labels=labels, autopct='%1.1f%%')
ax.set_title("Experienced Data Analysis Issues");
fig.tight_layout()

glue(
    '2021_num_solvers',
    gluval(unsolvable.shape[0], data.shape[0]),
    display=False,
)
glue(
    '2021_num_unsolved',
    gluval(num_yes, unsolvable.shape[0]),
    display=False
)
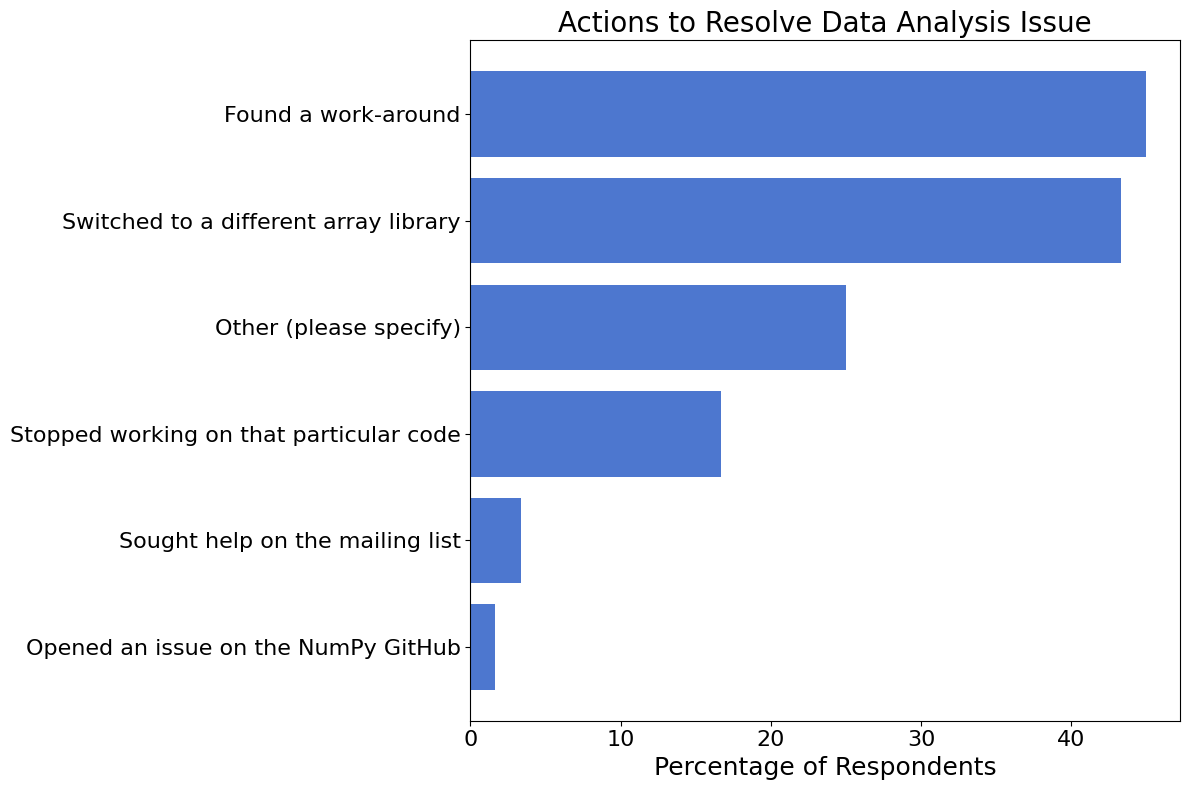
We asked those that responded “Yes” to the previous question what action(s) they took to resolve the issue.
Show code cell source
resolution = data['unsolvable_resolution'][data['unsolvable'] == 'Yes']
resolution = resolution[resolution != '']
labels, cnts = np.unique(flatten(resolution), return_counts=True)
I = np.argsort(cnts)
labels, cnts = labels[I], cnts[I]

fig, ax = plt.subplots(figsize=(12, 8))
ax.barh(
    np.arange(len(labels)),
    100 * cnts / resolution.shape[0],
    tick_label=labels,
)
ax.set_xlabel('Percentage of Respondents')
ax.set_title("Actions to Resolve Data Analysis Issue");
fig.tight_layout()
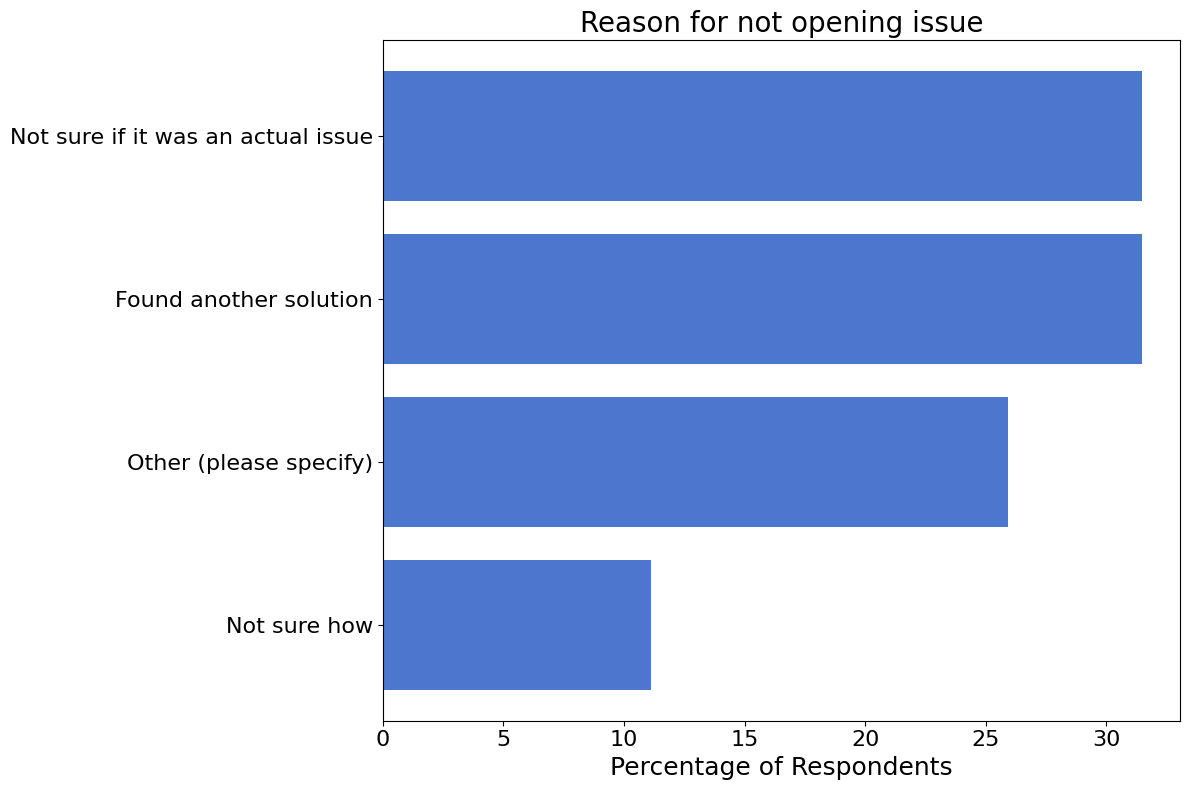
Opening Issues#
54 (10%) respondents reported having a problem with numerical data that they were unable to solve using NumPy, and did not open an issue. They were then asked why they did not open an issue for their particular problem.
Show code cell source
open_issues = data['issues'][data['issues'] != '']
labels, cnts = np.unique(flatten(open_issues), return_counts=True)
I = np.argsort(cnts)
labels, cnts = labels[I], cnts[I]

fig, ax = plt.subplots(figsize=(12, 8))
ax.barh(
    np.arange(len(labels)),
    100 * cnts / open_issues.shape[0],
    tick_label=labels,
)
ax.set_xlabel('Percentage of Respondents')
ax.set_title("Reason for not opening issue");
fig.tight_layout()

glue(
    '2021_num_open_issues',
    gluval(open_issues.shape[0], data.shape[0]),
    display=False,
)
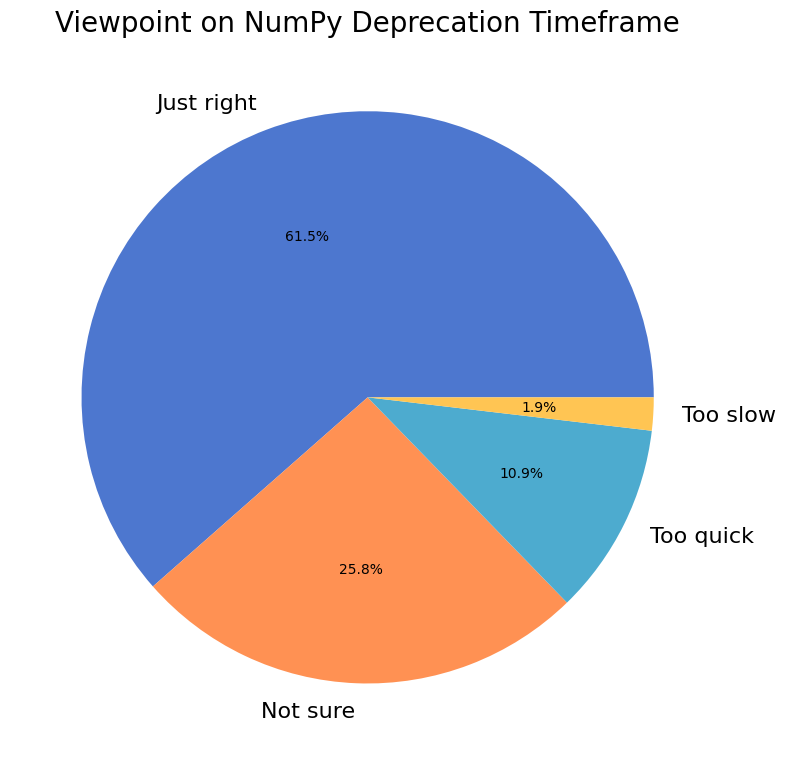
Deprecation Timeframe#
We asked survey participants to share their opinion on the NumPy deprecation cycle, specifically:
NumPy normally has a two release cycle (1 year) deprecation policy. Do you think this is…
Of the 522 survey participants,
322 (62%) responded to this question.
Show code cell source
current_dep = data['deprecation_short'][data['deprecation_short'] != '']
labels, cnts = np.unique(current_dep, return_counts=True)

fig, ax = plt.subplots(figsize=(8, 8))
ax.pie(cnts, labels=labels, autopct='%1.1f%%')
ax.set_title("Viewpoint on NumPy Deprecation Timeframe");
fig.tight_layout()

glue(
    '2021_num_dep_short',
    gluval(current_dep.shape[0], data.shape[0]),
    display=False
)
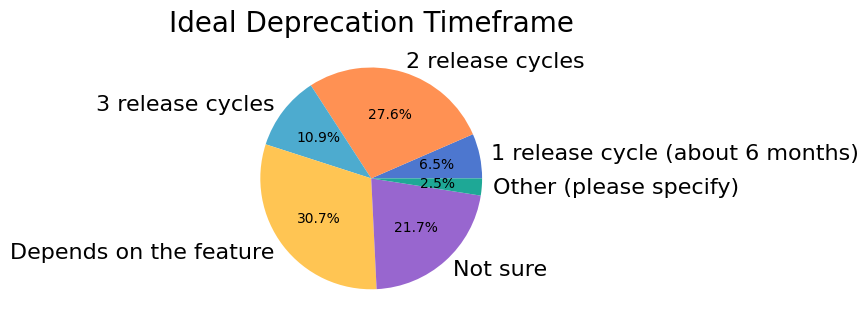
We also asked the following:
What do you consider as a good deprecation time frame?
Of the 522 survey participants,
322 (62%) responded to this question.
Show code cell source
depcycle = data['deprecation'][data['deprecation'] != '']
labels, cnts = np.unique(depcycle, return_counts=True)

fig, ax = plt.subplots(figsize=(8, 8))
ax.pie(cnts, labels=labels, autopct='%1.1f%%')
ax.set_title("Ideal Deprecation Timeframe");
fig.tight_layout()

glue(
    '2021_dep_opinions',
    gluval(depcycle.shape[0], data.shape[0]),
    display=False
)