numpy.random.Generator.standard_gamma
method
-
Generator.standard_gamma(shape, size=None, dtype=np.float64, out=None)¶ Draw samples from a standard Gamma distribution.
Samples are drawn from a Gamma distribution with specified parameters, shape (sometimes designated “k”) and scale=1.
- Parameters
- shape
floator array_like of floats Parameter, must be non-negative.
- size
intortupleof ints, optional Output shape. If the given shape is, e.g.,
(m, n, k), thenm * n * ksamples are drawn. If size isNone(default), a single value is returned ifshapeis a scalar. Otherwise,np.array(shape).sizesamples are drawn.- dtypedtype, optional
Desired dtype of the result, only float64 and float32 are supported. Byteorder must be native. The default value is np.float64.
- out
ndarray, optional Alternative output array in which to place the result. If size is not None, it must have the same shape as the provided size and must match the type of the output values.
- shape
- Returns
- out
ndarrayor scalar Drawn samples from the parameterized standard gamma distribution.
- out
See also
scipy.stats.gammaprobability density function, distribution or cumulative density function, etc.
Notes
The probability density for the Gamma distribution is

where
 is the shape and
  the scale,
and
the scale,
and  is the Gamma function.
The Gamma distribution is often used to model the times to failure of electronic components, and arises naturally in processes for which the waiting times between Poisson distributed events are relevant.
References
- 1
Weisstein, Eric W. “Gamma Distribution.” From MathWorld–A Wolfram Web Resource. http://mathworld.wolfram.com/GammaDistribution.html
- 2
Wikipedia, “Gamma distribution”, https://en.wikipedia.org/wiki/Gamma_distribution
Examples
Draw samples from the distribution:
>>> shape, scale = 2., 1. # mean and width
>>> s = np.random.default_rng().standard_gamma(shape, 1000000)
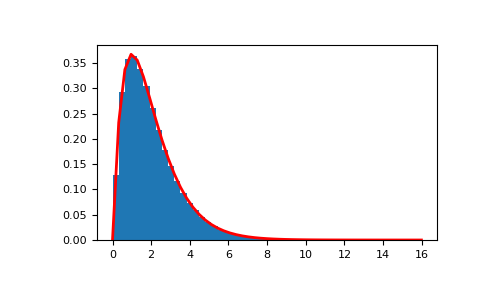
Display the histogram of the samples, along with the probability density function:
>>> import matplotlib.pyplot as plt
>>> import scipy.special as sps
>>> count, bins, ignored = plt.hist(s, 50, density=True)
>>> y = bins**(shape-1) * ((np.exp(-bins/scale))/
...                       (sps.gamma(shape) * scale**shape))
>>> plt.plot(bins, y, linewidth=2, color='r')
>>> plt.show()