Usage#
Show code cell source
fname = "data/2020/numpy_survey_results.tsv"
column_names = [
    'using_random', 'bug', 'bug_resolution', 'bug_resolution_other',
    'unsolvable', 'unsolvable_resolution', 'unsolvable_resolution_other',
    'deprecation', 'deprecation_other'
]
featdep_dtype = np.dtype({
    "names": column_names,
    "formats": ['U1024'] * len(column_names),
})

data = np.loadtxt(
    fname, delimiter='\t', skiprows=3, dtype=featdep_dtype,
    usecols=range(87, 96), comments=None
)
This section comprises various questions to try to gain insight on things like new feature adoption, issue resolution, and the length of deprecation cycles.
New numpy.random Adoption#
A new API for random number generation was added to numpy.random
in version 1.17.
We asked survey paricipants whether they were using the new random API.
Of the 1236 survey participants,
596 (48%) shared whether they were using the new random
API.
Show code cell source
rand = data['using_random'][data['using_random'] != '']
labels, cnts = np.unique(rand, return_counts=True)

fig, ax = plt.subplots(figsize=(8, 8))
ax.pie(cnts, labels=labels, autopct='%1.1f%%')
fig.tight_layout()

glue(
    'num_random_users',
    gluval(rand.shape[0], data.shape[0]),
    display=False
)
Handling Issues#
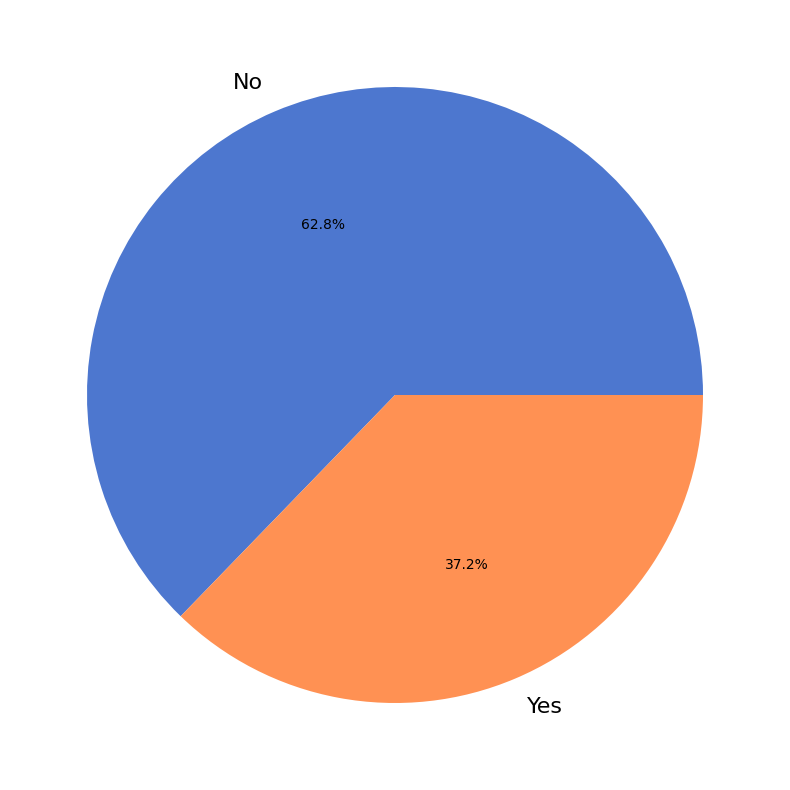
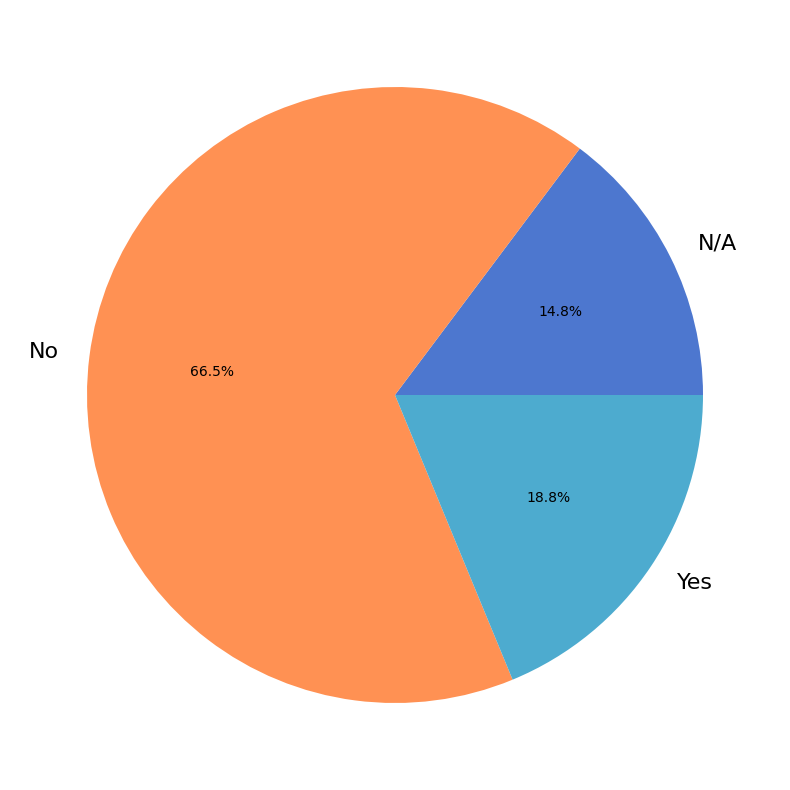
We wanted to get a sense of how often users experience issues with NumPy, so we asked the following question:
In the last year, have you experienced problems in code you’ve written stemming from a problem in NumPy?
Of the 1236 survey participants,
885 (72%) responded to this question.
Show code cell source
bug = data['bug'][data['bug'] != '']
labels, cnts = np.unique(bug, return_counts=True)

fig, ax = plt.subplots(figsize=(8, 8))
ax.pie(cnts, labels=labels, autopct='%1.1f%%', labeldistance=None)
ax.legend()
fig.tight_layout()

glue(
    'bug_reporters',
    gluval(bug.shape[0], data.shape[0]),
    display=False,
)
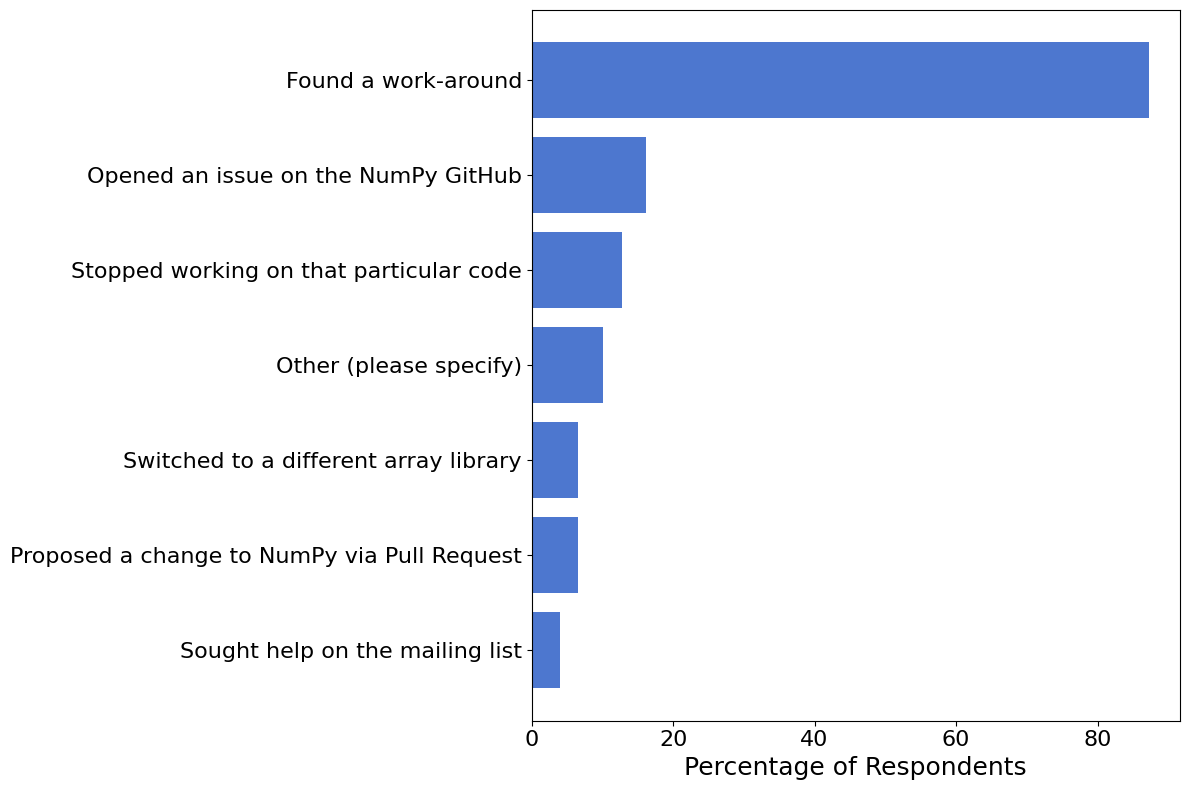
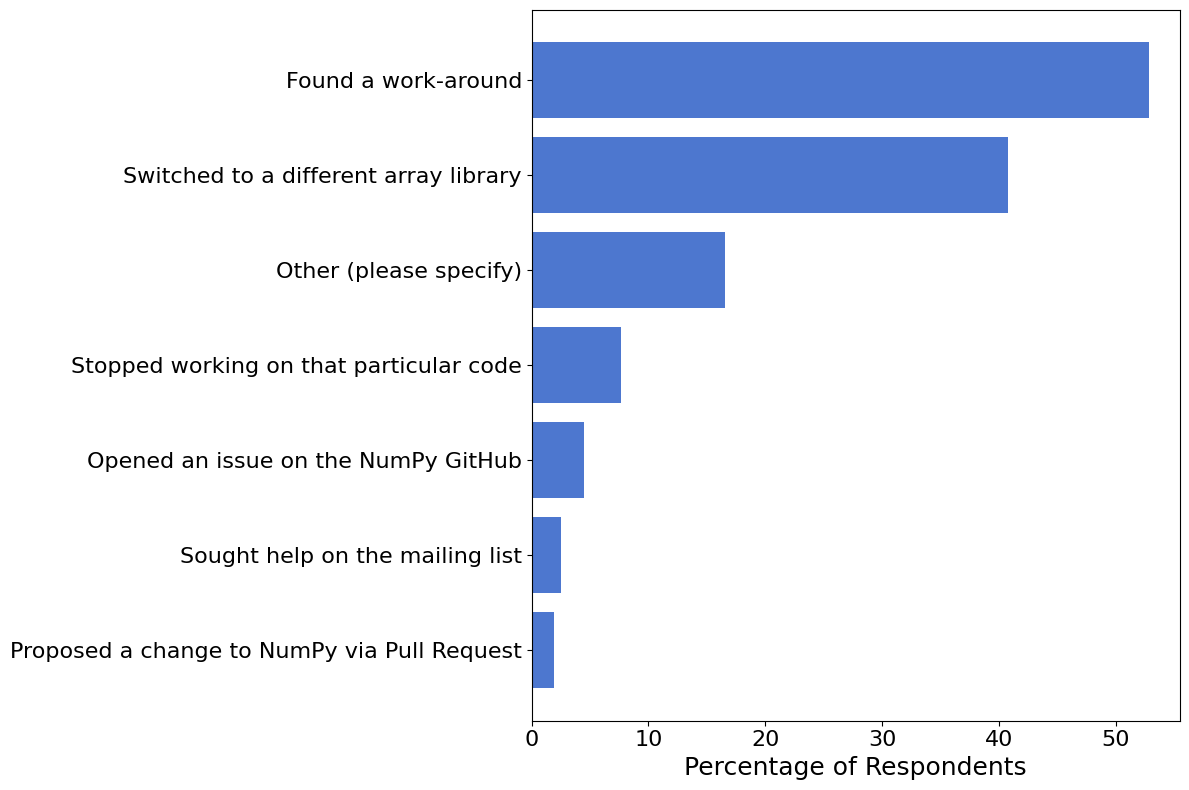
We asked those who reported experience issues what action(s) they took to resolve the issue.
Show code cell source
bug_resolution = data['bug_resolution'][data['bug_resolution'] != '']
labels, cnts = np.unique(flatten(bug_resolution), return_counts=True)
I = np.argsort(cnts)
labels, cnts = labels[I], cnts[I]

fig, ax = plt.subplots(figsize=(12, 8))
ax.barh(
    np.arange(len(labels)),
    100 * cnts / bug_resolution.shape[0],
    tick_label=labels,
)
ax.set_xlabel('Percentage of Respondents')
fig.tight_layout()
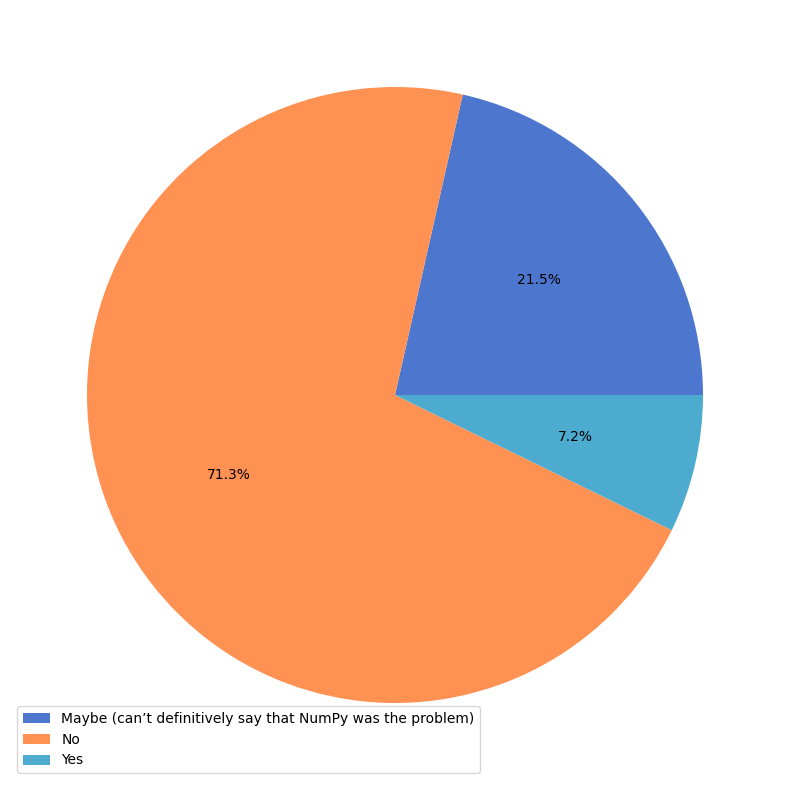
Data Analysis with NumPy#
Similar to the the previous question, we tried to get a sense of how well NumPy meets users’ data analysis needs. We asked the following question:
In the last year, have you encountered a problem involving numerical data that you were unable to solve using NumPy?
Of the 1236 survey participants,
874 (71%) responded to the above question, with
164 (19%) reporting that they’ve had a problem that they
initially expected to be able to solve using NumPy, but were unable to do so.
Show code cell source
unsolvable = data['unsolvable'][data['unsolvable'] != '']
labels, cnts = np.unique(unsolvable, return_counts=True)
num_yes = np.sum(unsolvable == 'Yes')

fig, ax = plt.subplots(figsize=(8, 8))
ax.pie(cnts, labels=labels, autopct='%1.1f%%')
fig.tight_layout()

glue(
    'num_solvers',
    gluval(unsolvable.shape[0], data.shape[0]),
    display=False,
)
glue(
    'num_unsolved',
    gluval(num_yes, unsolvable.shape[0]),
    display=False
)
We asked those that responded “Yes” to the previous question what action(s) they took to resolve the issue.
Show code cell source
resolution = data['unsolvable_resolution'][data['unsolvable'] == 'Yes']
resolution = resolution[resolution != '']
labels, cnts = np.unique(flatten(resolution), return_counts=True)
I = np.argsort(cnts)
labels, cnts = labels[I], cnts[I]

fig, ax = plt.subplots(figsize=(12, 8))
ax.barh(
    np.arange(len(labels)),
    100 * cnts / resolution.shape[0],
    tick_label=labels,
)
ax.set_xlabel('Percentage of Respondents')
fig.tight_layout()
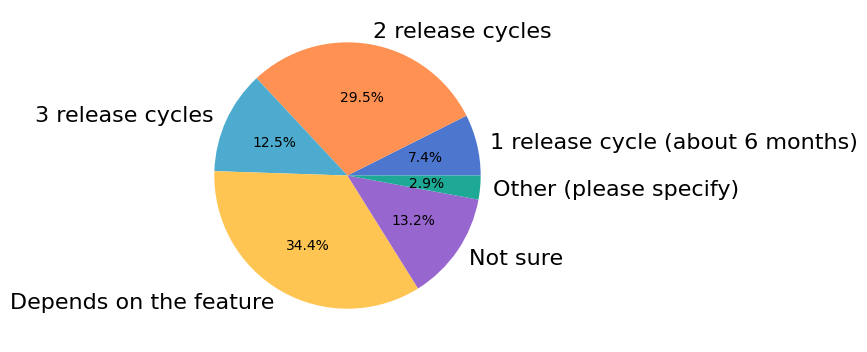
Deprecation Timeframe#
We asked survey participants to share their opinion on the NumPy deprecation cycle, specifically:
What do you consider as a good deprecation time frame?
Of the 1236 survey participants,
863 (70%) responded to this question.
Show code cell source
depcycle = data['deprecation'][data['deprecation'] != '']
labels, cnts = np.unique(depcycle, return_counts=True)

fig, ax = plt.subplots(figsize=(8, 8))
ax.pie(cnts, labels=labels, autopct='%1.1f%%')
fig.tight_layout()

glue(
    'dep_opinions',
    gluval(depcycle.shape[0], data.shape[0]),
    display=False
)