Quantifying spinal cord regeneration in zebrafish
Contents
from __future__ import division, print_function
%matplotlib inline
Quantifying spinal cord regeneration in zebrafish
We want to quantify the amount of fluorescent cells in a wounded zebrafish embryo spinal column:

The key steps are:
estimating the position and width of the cord
estimating the average fluorescence along the length of the cord
from matplotlib import pyplot as plt, cm
from skimage import io
image = io.imread('../images/zebrafish-spinal-cord.png')
SciPy to estimate coordinates
First, we get just the top and bottom rows of pixels, and use a 1D gaussian filter to smooth the signal.
from scipy import ndimage as nd
top, bottom = image[[0, -1], :]

fig, (ax0, ax1) = plt.subplots(nrows=1, ncols=2, figsize=(8, 3))

top_smooth = nd.gaussian_filter1d(top, sigma=20)
ax0.plot(top, color='blue', lw=2)
ax0.plot(top_smooth, color='orange', lw=2)
ax0.set_title('top')

bottom_smooth = nd.gaussian_filter1d(bottom, sigma=20)
ax1.plot(bottom, color='blue', lw=2)
ax1.plot(bottom_smooth, color='orange', lw=2)
ax1.set_title('bottom')
Text(0.5, 1.0, 'bottom')
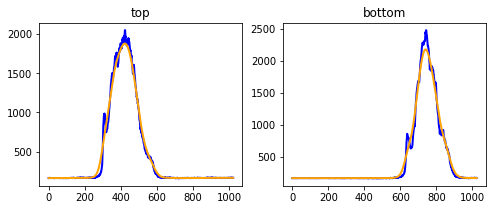
With smooth curves, we can get the mode (the position of the center) and width of the signal.
top_mode = top_smooth.argmax()
top_max = top_smooth[top_mode]
top_width = (top_smooth > float(top_max) / 2).sum()

bottom_mode = bottom_smooth.argmax()
bottom_max = bottom_smooth[bottom_mode]
bottom_width = (bottom_smooth > float(bottom_max) / 2).sum()

width = max(bottom_width, top_width)

print(top_mode, top_width, bottom_mode, bottom_width)
421 181 739 142
scikit-image to trace the profile
Now, use measure.profile_line to trace from (0, top_mode) to (-1, bottom_mode).
from skimage import measure
trace = measure.profile_line(None) # Replace `None` with correct args
Finally, plot the trace.
plt.plot(trace, color='black', lw=2)
plt.xlabel('position along embryo')
plt.ylabel('mean fluorescence intensity')
From this trace, we can compute various summary statistics (e.g. min/max, gap width, slope, etc), and plot these over time as the wound recovers.