numpy.random.triangular
-
numpy.random.triangular(left, mode, right, size=None)¶ Draw samples from the triangular distribution over the interval
[left, right].The triangular distribution is a continuous probability distribution with lower limit left, peak at mode, and upper limit right. Unlike the other distributions, these parameters directly define the shape of the pdf.
Note
New code should use the
triangularmethod of adefault_rng()instance instead; see random-quick-start.- Parameters
- left
floator array_like of floats Lower limit.
- mode
floator array_like of floats The value where the peak of the distribution occurs. The value must fulfill the condition
left <= mode <= right.- right
floator array_like of floats Upper limit, must be larger than left.
- size
intortupleof ints, optional Output shape. If the given shape is, e.g.,
(m, n, k), thenm * n * ksamples are drawn. If size isNone(default), a single value is returned ifleft,mode, andrightare all scalars. Otherwise,np.broadcast(left, mode, right).sizesamples are drawn.
- left
- Returns
- out
ndarrayor scalar Drawn samples from the parameterized triangular distribution.
- out
See also
Generator.triangularwhich should be used for new code.
Notes
The probability density function for the triangular distribution is

The triangular distribution is often used in ill-defined problems where the underlying distribution is not known, but some knowledge of the limits and mode exists. Often it is used in simulations.
References
- 1
Wikipedia, “Triangular distribution” https://en.wikipedia.org/wiki/Triangular_distribution
Examples
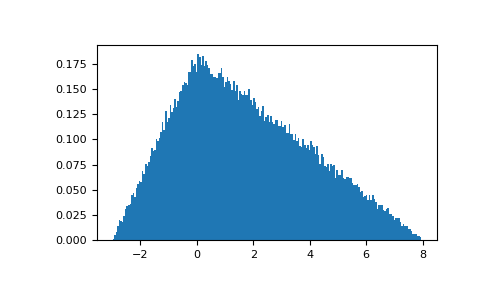
Draw values from the distribution and plot the histogram:
>>> import matplotlib.pyplot as plt
>>> h = plt.hist(np.random.triangular(-3, 0, 8, 100000), bins=200,
...              density=True)
>>> plt.show()