numpy.sinc
-
numpy.sinc(x)[source]¶ Return the normalized sinc function.
The sinc function is
 .
.Note
Note the normalization factor of
piused in the definition. This is the most commonly used definition in signal processing. Usesinc(x / np.pi)to obtain the unnormalized sinc function that is more common in mathematics.
- Parameters
- x
ndarray Array (possibly multi-dimensional) of values for which to to calculate
sinc(x).
- x
- Returns
- out
ndarray sinc(x), which has the same shape as the input.
- out
Notes
sinc(0)is the limit value 1.The name sinc is short for “sine cardinal” or “sinus cardinalis”.
The sinc function is used in various signal processing applications, including in anti-aliasing, in the construction of a Lanczos resampling filter, and in interpolation.
For bandlimited interpolation of discrete-time signals, the ideal interpolation kernel is proportional to the sinc function.
References
- 1
Weisstein, Eric W. “Sinc Function.” From MathWorld–A Wolfram Web Resource. http://mathworld.wolfram.com/SincFunction.html
- 2
Wikipedia, “Sinc function”, https://en.wikipedia.org/wiki/Sinc_function
Examples
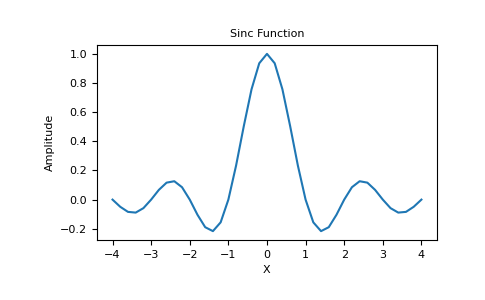
>>> import matplotlib.pyplot as plt
>>> x = np.linspace(-4, 4, 41)
>>> np.sinc(x)
 array([-3.89804309e-17,  -4.92362781e-02,  -8.40918587e-02, # may vary
        -8.90384387e-02,  -5.84680802e-02,   3.89804309e-17,
        6.68206631e-02,   1.16434881e-01,   1.26137788e-01,
        8.50444803e-02,  -3.89804309e-17,  -1.03943254e-01,
        -1.89206682e-01,  -2.16236208e-01,  -1.55914881e-01,
        3.89804309e-17,   2.33872321e-01,   5.04551152e-01,
        7.56826729e-01,   9.35489284e-01,   1.00000000e+00,
        9.35489284e-01,   7.56826729e-01,   5.04551152e-01,
        2.33872321e-01,   3.89804309e-17,  -1.55914881e-01,
       -2.16236208e-01,  -1.89206682e-01,  -1.03943254e-01,
       -3.89804309e-17,   8.50444803e-02,   1.26137788e-01,
        1.16434881e-01,   6.68206631e-02,   3.89804309e-17,
        -5.84680802e-02,  -8.90384387e-02,  -8.40918587e-02,
        -4.92362781e-02,  -3.89804309e-17])
>>> plt.plot(x, np.sinc(x))
[<matplotlib.lines.Line2D object at 0x...>]
>>> plt.title("Sinc Function")
Text(0.5, 1.0, 'Sinc Function')
>>> plt.ylabel("Amplitude")
Text(0, 0.5, 'Amplitude')
>>> plt.xlabel("X")
Text(0.5, 0, 'X')
>>> plt.show()